SANGAM / ATTACK SURFACE INTELLIGENCE

See your site
the way an
attacker does.

Simulate drone attacks. Find defensive blind spots. Prioritise action before an incident.

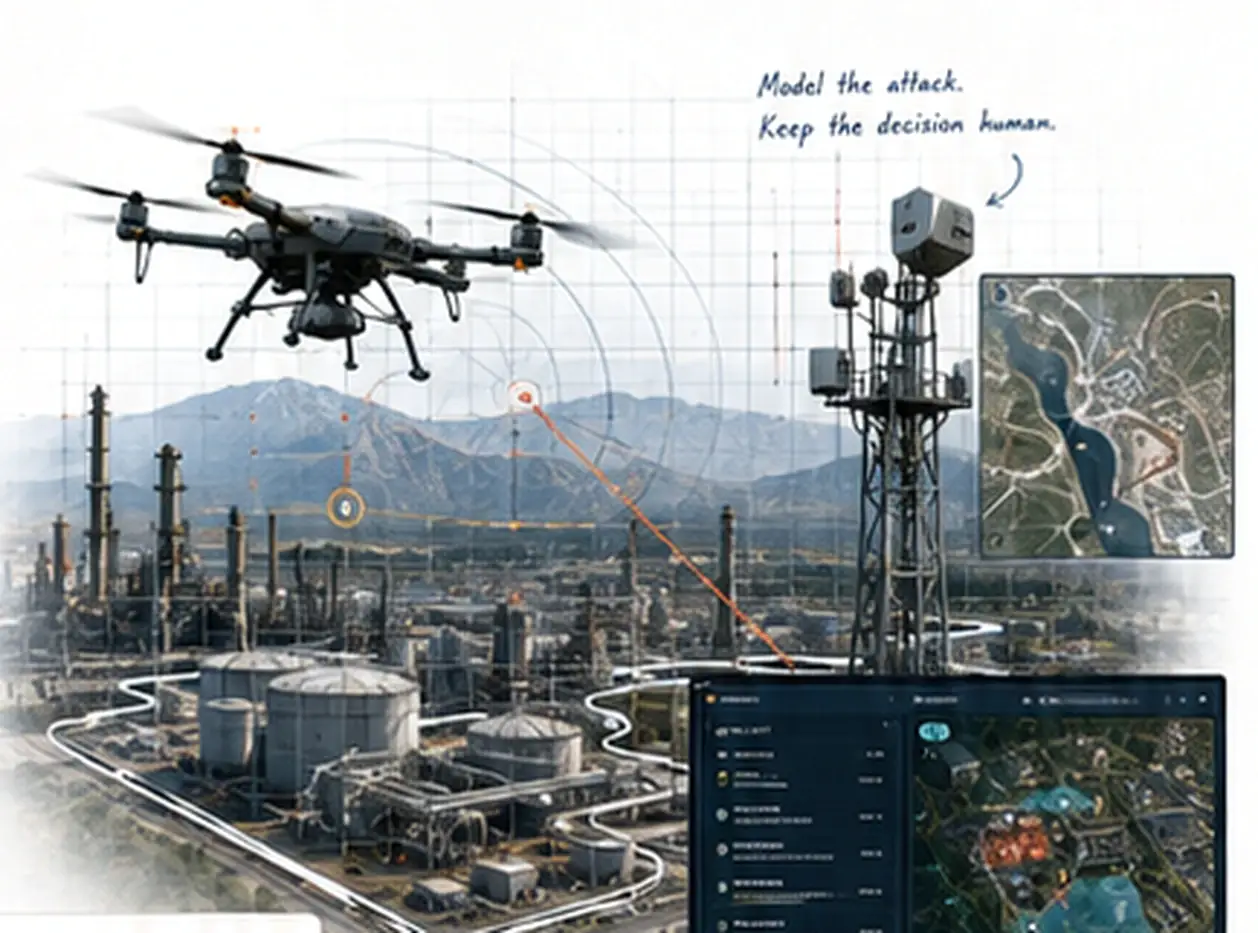
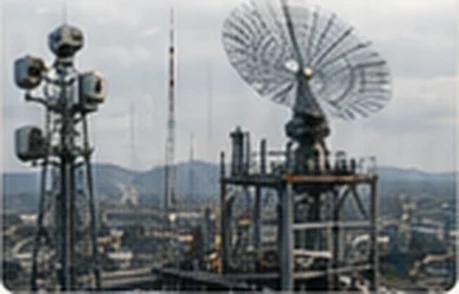
Drone approaching a refinery with sensor tower, simulated detection rings, terrain map and an offline SANGAM console

Fully air-gapped

No data leaves your site.

Human approval always

You decide. We support.

Explainable and auditable

Built for trust and accountability.

From attack path to informed action.

1

Model the site

Build a precise site model with assets, no-fly data and protective measures.
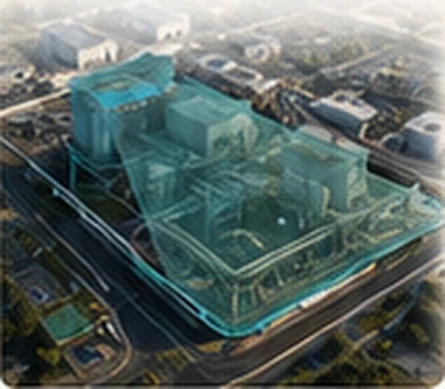
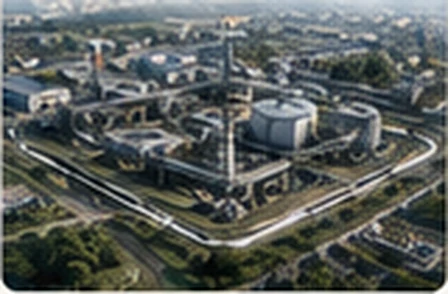
3D site model of a refinery with zones and assets mapped in SANGAM
2

Simulate the approach

Test multiple drone routes, heights and behaviours.
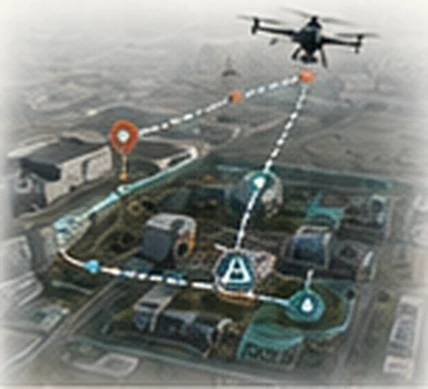
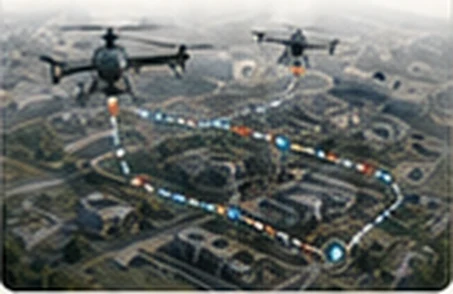
Simulated drone attack path with waypoints drawn over a facility map
3

Detect the blind spot

Surface weak coverage and exposure with an explainable A–E risk grade.
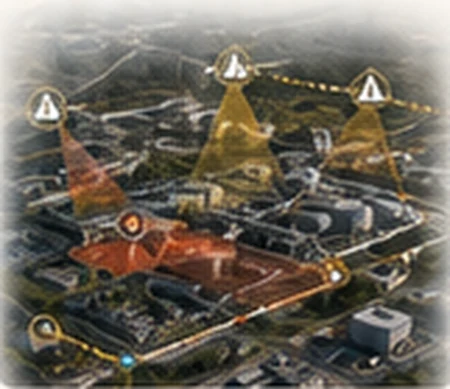
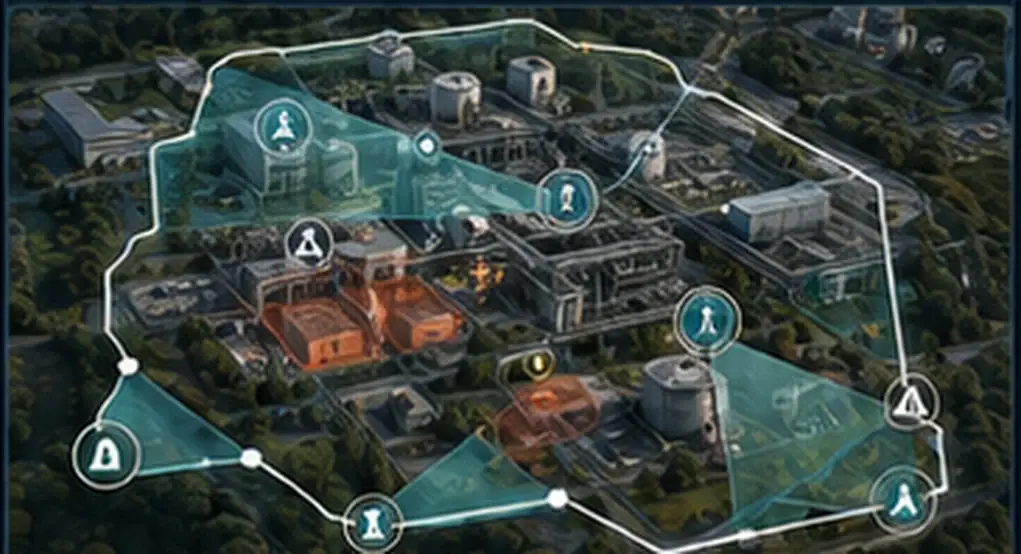
Sensor coverage map highlighting detection gaps and blind spots in red
4

Review and approve

Analysts review findings and prioritise action with evidence.

Security analysts reviewing simulation findings on control-room screens

Operational picture. Unified on-site command.

SITE STATUS

RISK SCORE

72 /100
Elevated
Top riskNorth process unit

COVERAGE

82%Sensors healthy

ASSETS MODELLED

236Updated today

Simulated operational picture

Simulated operational map of a site showing detection zones, sensor markers and a drone route
SIMULATION TIMELINE00:07:42
Simulated pathDetected droneSensor coverageRisk areaPoint of interest

TRACKED DRONES

3Active
IDTYPESTATUS
DR-13QuadcopterSimulated
DR-27QuadcopterSimulated
DR-31Fixed-wingSimulated
VIEW ALL

ALERT QUEUE

!
Gap detectedNorth perimeter
High
!
Altitude anomalySouth tank farm
Medium
!
Route proximityAdmin block
Low
VIEW ALL

One system. Four critical capabilities.

Site modelling

High-fidelity site models with assets, terrain and no-fly data.

Learn more
Modelled industrial site with perimeter and critical assets for drone vulnerability assessment

Attack simulation

Run realistic drone behaviours across routes, altitudes and payloads.

Learn more
Simulated drones flying test attack routes over a mapped critical site

Multi-sensor tracking

Fuse radar, RF, EO/IR and ADS-B for continuous, low false alarms.

Learn more
Radar, RF and camera sensors monitoring airspace over a critical infrastructure site

Decision and evidence

Analyst workflows, approvals and audit-ready reports.

Learn more
Operator reviewing detections and audit evidence on a SANGAM console

Nothing leaves the site.

TAEGIS Edge appliance installed in an on-site server room

LOCAL DEPLOYMENT

Sensors
TAEGISTAEGIS
Edge
On-site
Workstations
Local Storage
Runs fully offlineAll processing on-site.
Zero outbound connectionsNo internet. No cloud.
Your data stays on-siteYou own and control it.
No autonomous actionHuman approval for every step.

What the assessment delivers.

Vulnerability map

Clear view of exposures, coverage gaps and risk hotspots.
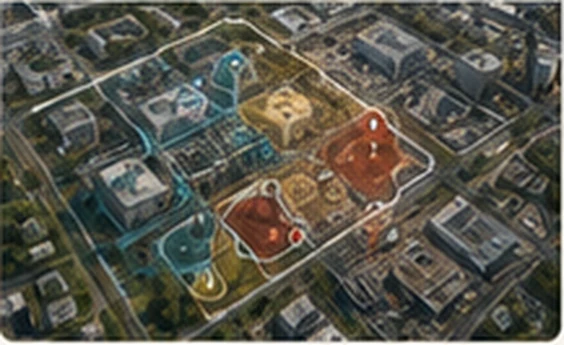
Vulnerability map showing exposure zones over a site

Prioritised recommendations

Actionable fixes ranked by risk, effort, impact and indicative cost.

PriorityActionRisk
Reduction
EffortIndicative
Cost
HighPerimeter radar repositioningHighMedium₹12–18L
HighEO camera coverageHighLow₹6–10L
MediumRF sensor tuningMediumLow₹2–4L
LowAccess control hardeningLowMedium₹3–6L

Illustrative values from a simulated assessment.

Decisionable evidence pack

Simulation logs, detections and approvals in an audit-ready pack.
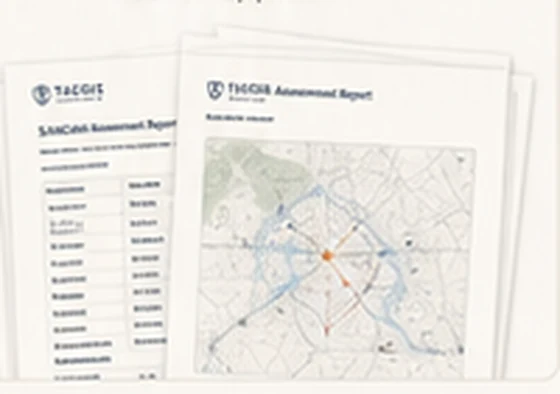
Printed SANGAM assessment report pack

Every report is gated: a Commander reviews and approves it before release, and the PDF is stamped with the approver’s name and date. Accepted risks stay visible in the report and never improve the grade.

Built for confidentiality.

Our engagements are confidential by design.
We share only with your permission.

Discretion is
part of the architecture.

Before and after. One virtual sensor, measured.

BEFORE — BASELINE

46.2 m

Closest undetected approach: a simulated night drone gets within 46.2 m of the most critical asset before any sensor sees it.

D
Site risk grade

AFTER — ONE PROPOSED RF SENSOR

210.8 m

The same attack is now detected 210.8 m out. Every approach frame is covered and the gap is closed — at an indicative cost of ₹25,00,000.

B
Site risk grade

Figures from a SANGAM assessment run on a simulated demonstration site. Every run is deterministic and explainable — the report shows exactly which factors moved the grade.

Request a confidential briefing.

Share a few details. We’ll respond with clarity, not slides.

Start the conversation